Previously we had a major post on different asset classes and where P2P lending fits in a well diversified portfolio. Today, we would do a statistical analysis of annualized returns of loans in P2P lending, specifically, those that are available on major platforms specializing in consumer debt financing namely Lending Club and Prosper.
Of the two major consumer debt marketplaces in the USA, Lending Club (LC) has received the majority of media attention sans successful IPO in December 2014. Due to the exposure, more so than ever, retail investors are looking at LC as a viable alternative to generate stable returns. Let us take a deeper look.
BOND RETURNS:
Let us evaluate BND (Vanguard Total Bond Market ETF) returns which we will take as a good estimation of the bond market in general. Since 5/2007 till 12/22/2014 BND payed a total dividend of $22.07 (see monthly returns graph below)
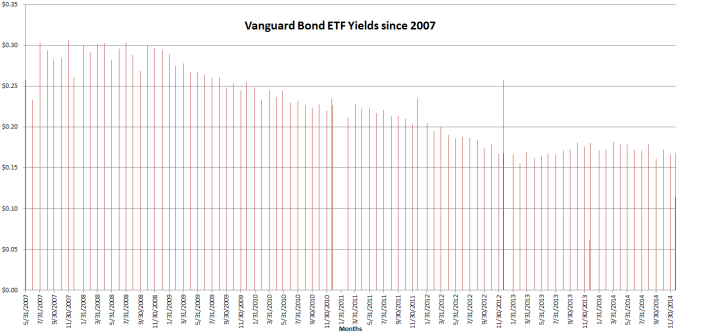
In these 2763 days, the Bond price it self has appreciated $8.91 (it increased from $73.84 to $82.75)
The Annual return is: (82.75 + 22.07)/(73.84)]^(365/2763) – 1 = 0.047 or 4.7%
LC RETURNS:
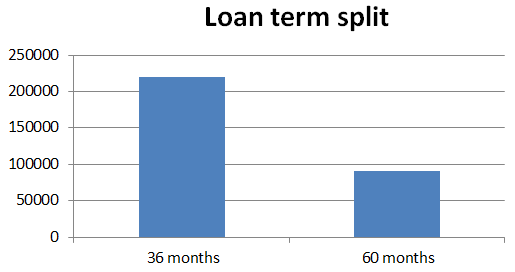
One of the best aspects about LC is their open data regarding loans originated. You can take a look at performance history right here. Using this readily available data, we can make general “claims” about consumer debt P2P lending. There are three data sets that are available: 2007-2011, 2012-2013 and 2014-12/31/2014. In total, 311241 loans are identified. A split of 36 vs 60 months term loan count is —
So how do we calculate average returns at Lending Club? The problem is that majority of loans are active and generating payments (look at their loan volume – it has exploded in the last few years so it is skewed!) The simplest and surest way is to exclude current loans. This leaves us with 80819 loans/notes that are NOT current. They are either payed off, default, charged off, in-grace period, and late.
These are the categories assigned by LC. A review of these is a matter of another blog post. Briefly, a loan is considered default if borrower has not payed for 121+ days. A loan becomes “Charged Off” when there is no longer a reasonable expectation of further payments. Charge Off typically occurs when a loan is 150 days past due (i.e. 30 days after the Default status is reached) and there is no reasonable expectation of sufficient payment to prevent the charge off.
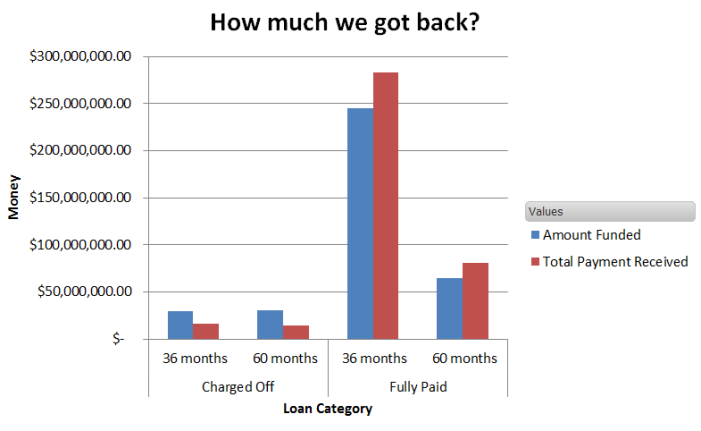
It may be that many of the loans in the cohort were just recently issued and immediately went into default or late payment or they were payed back before their term (early pay back). This will skew the data. For many such reasons , we will look at mature loans: for 60 month term loans those that were issued before December 2009 (although unfortunately no such data exists as 60 months loans were started in 2010 so we will sift through ones before December 2010 and were clearly payed back early or charged-off); and for 36 month term loans those that were originated before December 2011. This is essentially the first downloaded data set. For simplicity we are only considering fully payed back, and charged offs. Lets split the volume by terms
For 36 months the number of loans fitting the criteria are —
| Charged Off | 3215 |
| Fully Paid | 25858 |
For 60 months the number of loans fitting the criteria are —
| Charged Off | 2095 |
| Fully Paid | 4381 |
Here is where it gets interesting. The returns for 36 month and 60 month term loan investments in this data is as follows:
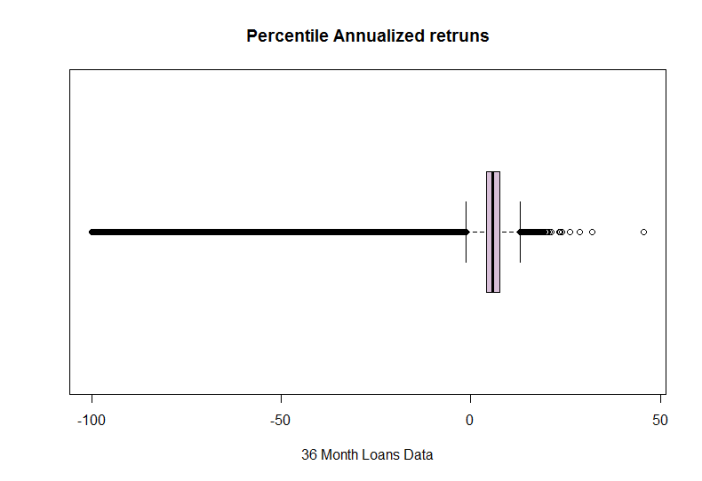
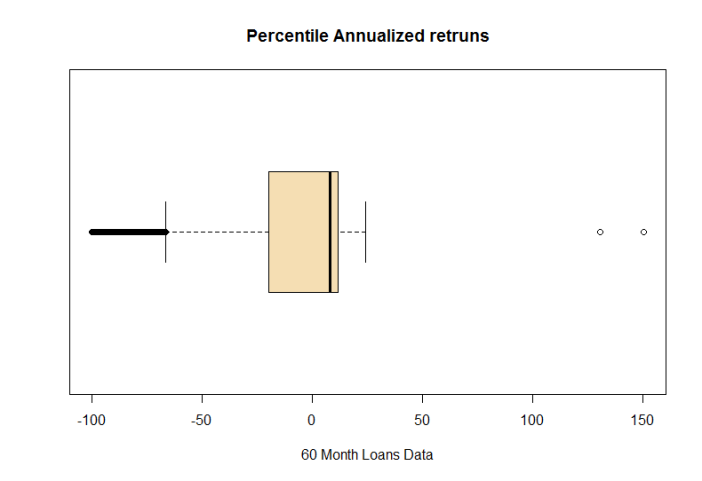
A boxplot (30 month term loans vs 60 month term loan annualized returns) reveals:
In short: Median investor in the 36 month term loans had a return of 5.86% and median investor in the 60 month term loans had annualized return of 7.9%
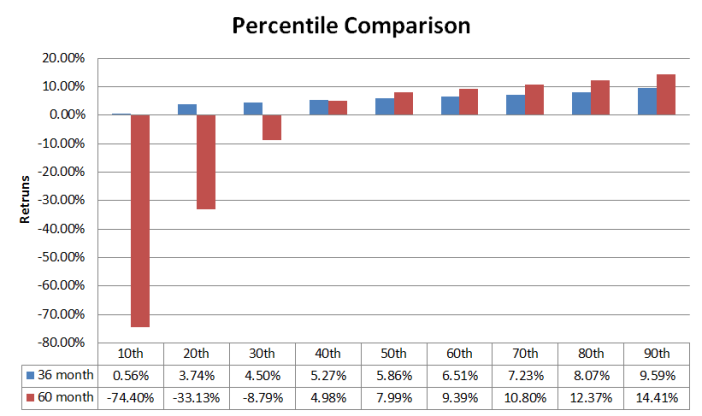
In fact, here is the graph of percentiles for both in a bar format —
Conclusions/take aways:
- Mature portfolio of loans from 2007 – 2011 has an annual return better than BND ETF. In addition, LendingClub underwriting has refined over the years to boost returns where loans by “vintage” (the year they were originated) have yielded higher returns. As P2P marketplace matures, returns are declining but so are defaults. Future post may explore returns of major marketplaces as a function of time (part 2).
- Risk reward strategy: 90th percentile investors in 60 month term loans earned a whopping 14.41% but the 10th percentile investor in this category has a -74.40%! Buyer beware.
- 36 term loan had a more “narrow” return range – a 10th percentile investor still received, albeit dismal, a positive return.
- The analysis is not including late, in-grace period loans which may very well be charged off in the future and will lower the returns.

Thanks for this analysis. Found it helpful. Please post more stats stuff.
LikeLike